


Thanks to Meera Menon for her help on this topic!
One value proposition of the VCF Platform is that it manages both, VM-based as well as Kubernetes-based workloads. VCF includes the vSphere Supervisor Services, which provide the capability of deploying fully supported Kubernetes Clusters. VCF Automation makes sure that consumers can provision VMs, other resources and Kubernetes using the same interface. They can decide to leverage the UI or APIs depending on their use case. Just recently Broadcom announced that the VKS Cluster Management functionality, which was previously mainly in the TMC (Tanzu Mission Control) solution, has been added to the VCF Automation capabilities. It takes care of policy management, backups, basic monitoring and more.
Monitoring VKS Clusters
The strategic monitoring component of the VCF stack is VCF Operations. Considering the above-mentioned common-platform strategy it also includes monitoring of the Kubernetes stack. For the supervisor clusters (Kubernetes services running directly on vSphere) VCF Operations detects them automatically, provides metrics for them and discovers potentially deployed VKS clusters. The latter was the functionality of the TMC management pack which is obsolete with VCF 9 because of the mentioned reasons. VCF Operations also supports monitoring of the VKS Clusters to show metrics like namespaces, pods used, their utilization and more. In the past this has been done by a Kubernetes management pack. Using the latest versions we have moved to a Telegraf / Prometheus data collection directly run from the VKS Clusters themselves. Once configured, VCF Operations retrieves the relevant metrics without the need to configure any management pack. VCF is pushing the Telegraf and Prometheus agents automatically to the cluster. All this is done through the VCF CLI.
In VCF 9 this requires a couple of configuration steps which I will outline in this blog. In future releases I hope that it will be more like an out-of-the-box experience.
This blog focusses on how to configure VKS clusters and VCF Operations to enable monitoring.
Note: This article is based on VCF Automation configuration. For a native vSphere environment, the process might differ slightly.
Prerequisites
For a successful configuration you’ll need some prerequisites which I will list here.
| VCF 9.0.1 | VCF 9.0.1 was used for this blog. Monitoring is supported with VCF 9.0.0 as well, but might require different versions compared to what is shown here. |
| Supervisor with min. medium control plane node | Required for the Management proxy |
| Supervisor Management Proxy service installed | Required to guarantee a working network configuration for monitoring. It might work without it as well if your workload and management network is routed and has no firewall restrictions in-between (didn’t test that). |
| Installation of VCF Automation 9 with All-Apps-Org | The blog is based on this configuration, however I will not walk through the process of configuring it as there is a lot of related material out there. All the processes I explain here are based on that configuration. It also requires a working NSX VPC and Supervisor Services configuration. |
| 1 deployed Kubernetes cluster with min. 4 CPU and 16GB RAM node size. | This is required for Telegraf and Prometheus installation. You might experience strange results if smaller Kubernetes clusters are used. |
| Internet connection | While VCF CLI and the other tools do support air-gapped installations as well, this blog explains the process for an internet-connected environment. |
Supervisor Management Proxy Service
The vSphere supervisor cluster supports adding additional services like VM service, Kubernetes services, database services etc. VKS monitoring requires the “Supervisor Management Proxy” Service which makes sure that Kubernetes Clusters can talk to the management components no matter if they are on separate and potentially firewalled networks.
As a prerequisite make sure that the supervisor control plane has at least a medium profile as otherwise the installation will fail due to resource constraints.
Follow below steps to do the installation:
Download the yaml file from the Broadcom support page. Go into the support portal and filter for VMware products and “supervisor”.

Under “vSphere Supervisor Services” you’ll find the “Supervisor Management Proxy 0.4.0” in the current version. Be aware that version 0.4.0 requires VCF 9.0.1.

For our simple configuration you just need to download the supervisor-management-proxy.yml as the configuration can be empty. There are more options to tailor it through the data values yaml if required.
Now go to the supervisor services configuration of your supervisor cluster and add a new service referencing to the yaml just downloaded.

After the upload has finished, just go to the service “manage service” and enable it for the supervisor cluster. As we don’t need configuration details it’s a rather straight forward process where the cluster must be selected and the process finished.


Once done you can verify in the supervisor configuration that the installation was performed properly. Everything is fine when the status says “Configured”.

VCF CLI and kubectl
VCF CLI is required to do the Telegraf and Prometheus configuration for the Kubernetes clusters. There are versions of it available for different operating systems including Linux derivates and Windows. Find more details in the official documentation on how to install it. As I am using a Windows system, I prefer downloading the binary and copying it to c:\windows\system32
Similarly, you must install the kubectl client tool where the process is explained in the Kubernetes documentation. Here it works the same to just copy the executable into the above directory (renamed to kubectl.exe) on Windows.
Create the VCF CLI Context
As first step create an API token on the VCF Automation interface for the user having admin privileges (in my case the first created user “configurationadmin”). This step must be done in the all-app-org where the Kubernetes cluster is provisioned in. Be aware that you see the API token only once during creation, so store it somewhere safely.

Next log on to the provider interface of VCF Automation (system tenant) and download the restbaseuri.1 certificate to the folder where you execute your vcf command from.

I renamed the file to “fleet-ca.crt” for easier usage.
The VCF CLI documentation explains how to do this process and also Thomas Fojta created a related blog. However, I will walk through the different steps in my environment here.
Now issue this command to create the vcf context for your VCF Automation environment.
vcf context create <random name of the context> --type cci --endpoint <FQDN of automation appliance --tenant-name <tenant name of all-apps-org> --ca-certificate ./fleet-ca.crt --api-token <api token retrieved before>This should result in a similar response:

Next, we will switch to the right project context. If there are multiple contexts, make sure to use the one which reflects your namespace and project: <contextname>:<namespace>:<project>
vcf context use auto01:sfo-ns-1-cgsxf:default-project
The following command will now list the available Kubernetes clusters on VCF Automation:
vcf cluster list
Here we will be using the kubernetes-cluster-10 cluster.
For VCF Automation the registration of the jwt-authenticator is necessary.
vcf cluster register-vcfa-jwt-authenticator kubernetes-cluster-10
We now need the kubeconfig of the Kubernetes cluster to get its context.
vcf cluster kubeconfig get kubernetes-cluster-10
By issuing the command mentioned in the previous output, the context of the VKS cluster is enabled.
kubectl config use-context vcf-cli-kubernetes-cluster-10-sfo-ns-1-cgsxf@kubernetes-cluster-10-sfo-ns-1-cgsxf
Now you can use below command to get the nodes of the VKS cluster. You might need to provide your api key for further authentication.
kubectl get nodes
Install packages on VKS Clusters
There are 2 application packages required on the VKS Clusters to enable monitoring: telegraf and prometheus. Before this can be done the previous steps must have been performed.
Install package management
As first step we verify that the package plugin is installed:
vcf plugin install package
Next, we add the VKS standard packages repo (you will see a lot of output). The proper URL can be found in the VKS Standard Packages Release Notes.
vcf package repository add broadcom-standard-repo --url projects.packages.broadcom.com/vsphere/supervisor/packages/2025.8.19/vks-standard-packages:v2025.8.19 -n tkg-system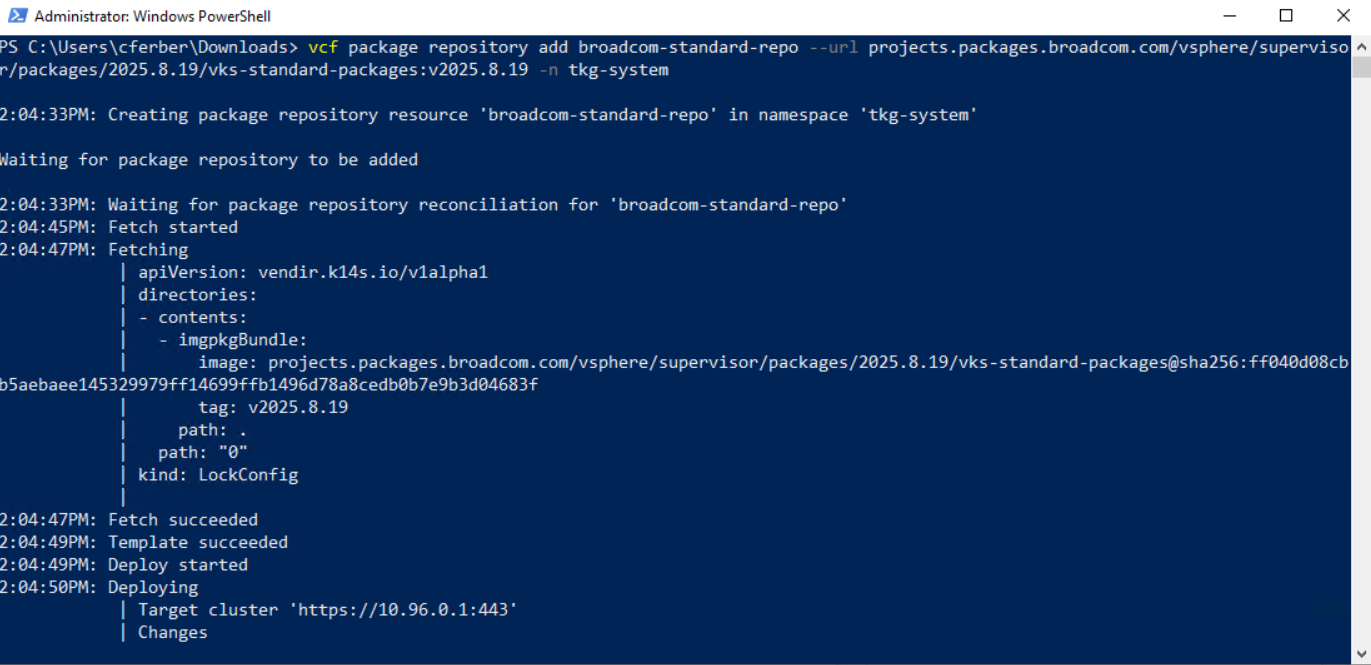
After this has finished, we can review the available packages. This should include telegraf and prometheus entries.
vcf package available list -n tkg-system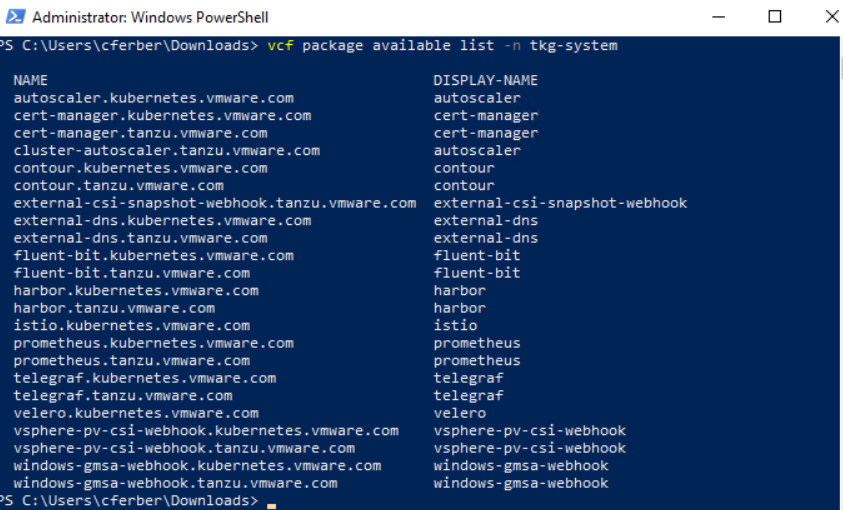
We can verify the prometheus version(s) available.
vcf package available get prometheus.kubernetes.vmware.com -n tkg-system
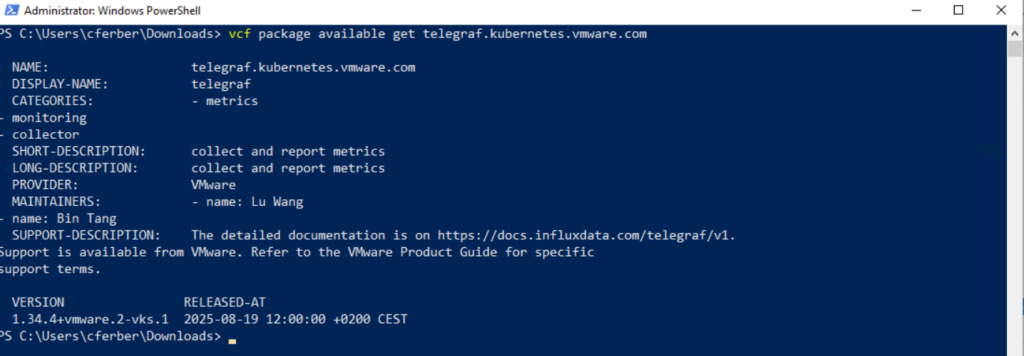
Same for the telegraf package:
Create a namespace for package installations
Let’s create a namespace for the installed packages:
kubectl create ns package-installs
Install Telegraf agent
For the telegraf installation a data values file is required. You can create a default file with the below command and modify it as needed. Make sure to use the version available on the system (see previous commands).
vcf package available get telegraf.kubernetes.vmware.com/1.34.4+vmware.2-vks.1 --default-values-file-output telegraf-data-values.yaml -n tkg-system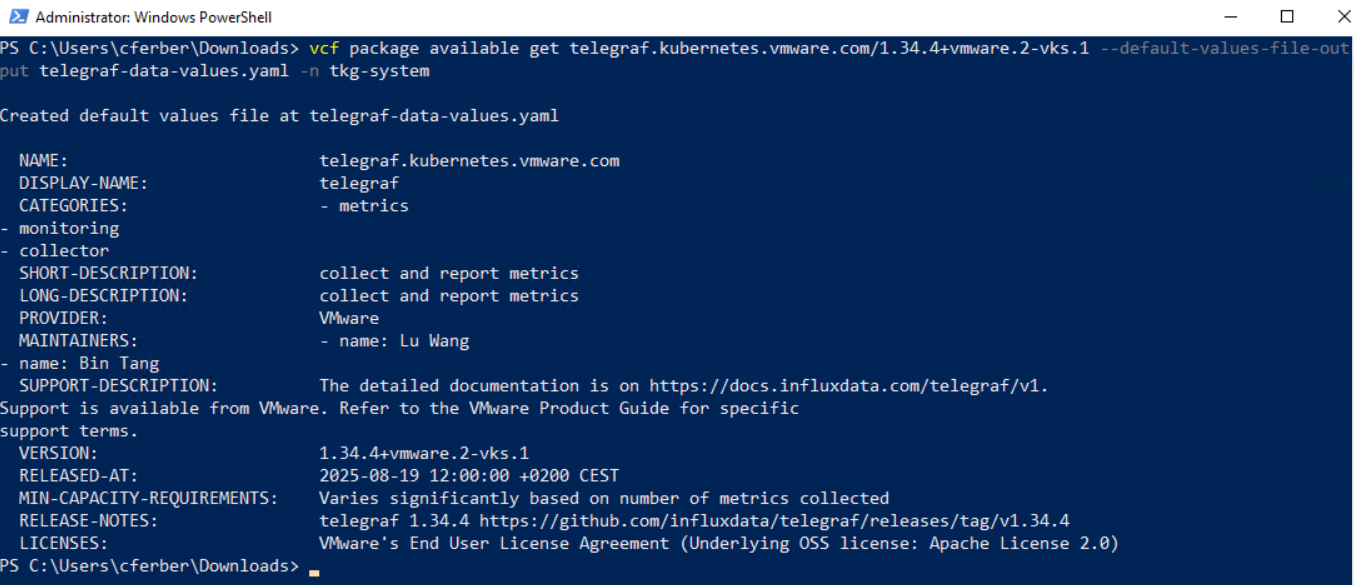
Edit the file, uncomment 2 lines and set the second one to “true”:
domainName: cluster.local
isMetricProxyConfigured: true
Finally, we can install the telegraf agent with this command:
vcf package install telegraf -p telegraf.kubernetes.vmware.com --version 1.34.4+vmware.2-vks.1 --values-file telegraf-data-values.yaml -n package-installsThis will install several pods and you should see a succeed message after 1-2 minutes.
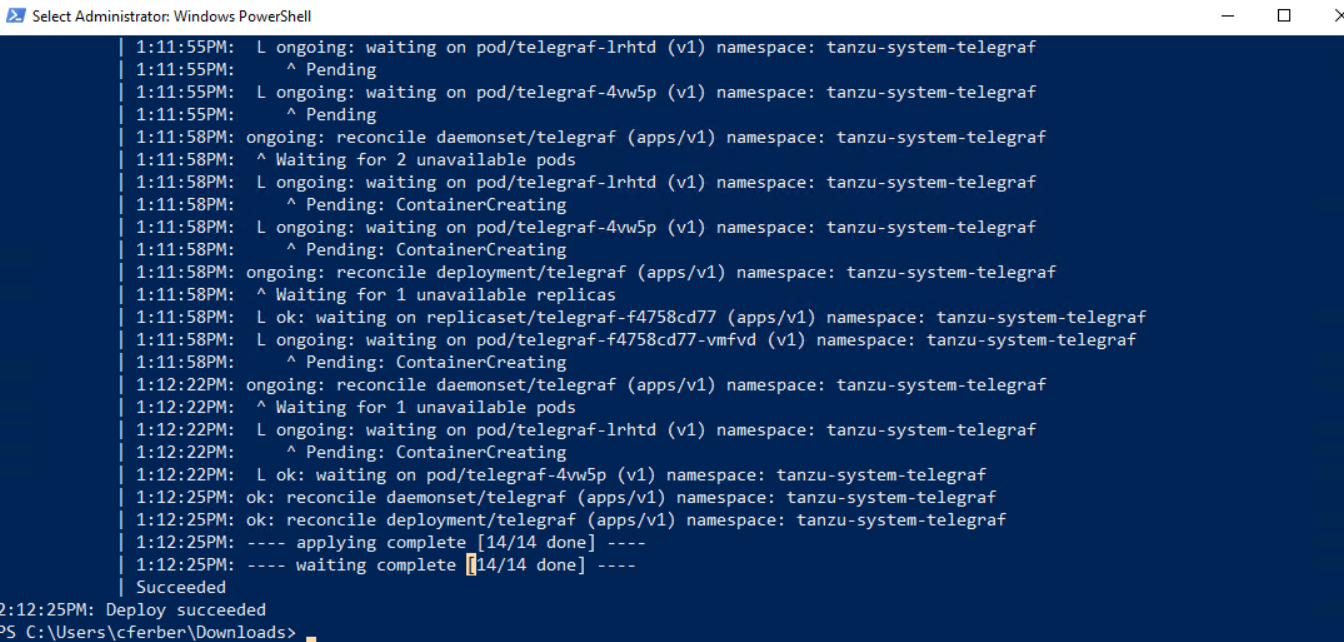
Check if the package has been installed properly:
kubectl get pkgi -n package-installs
kubectl get all -n tanzu-system-telegraf 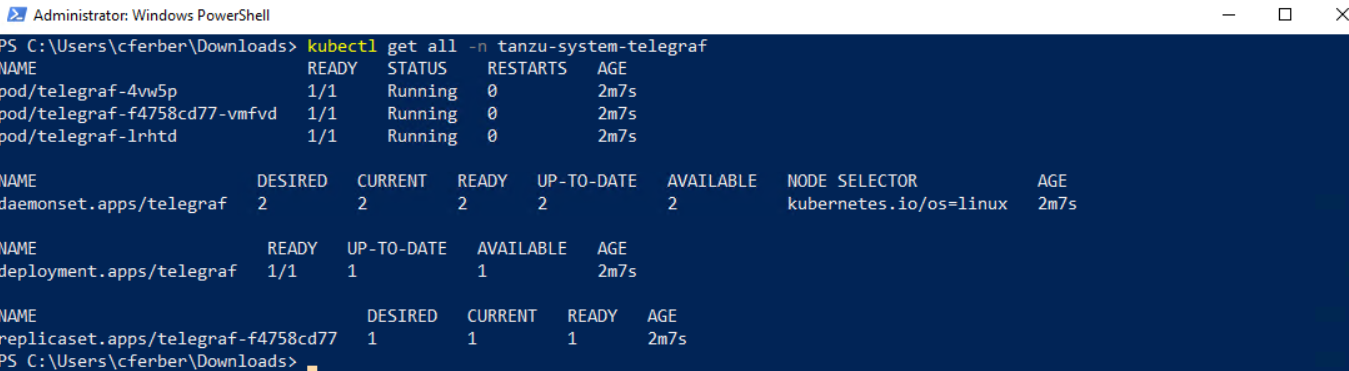
Install Prometheus
The last part to enable proper monitoring is the installation of the prometheus agent. It’s like telegraf where you need a data values file beforehand. In this case however you need to create a template file manually from the documentation template. Use your favorite editor to create the file “prometheus-data-file.yml” in the directory where the vcf command is executed. Copy the whole content from the grey box on the documentation page to the file. The only modification that needs to be done is to change the storageClassName values to the storageClass you use for your Kubernetes Cluster provisioning in VCF Automation.

You should find 2 occurrences of storageClassName in the yaml file – one for a 2GiB volume and one for a 20GiB volume.
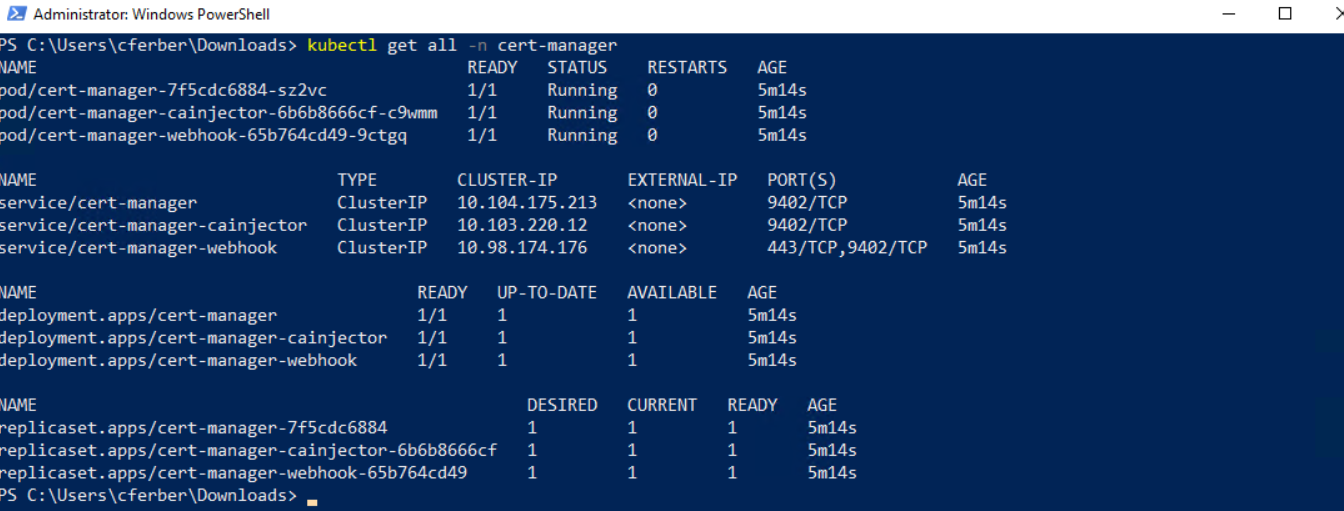
Before the actual prometheus installation, the CRDs (custom resource definitions) for cert-manager and contour are required. Install them using the same method as for telegraf.
vcf package install cert-manager -p cert-manager.kubernetes.vmware.com -n package-installs

vcf package install contour -p contour.kubernetes.vmware.com -n package-installs
Verify a successful installation:

As next step install the prometheus package leveraging the values file. If you are asked for the api token, paste the one from the previous steps. This process will take 2-3 minutes depending on your cluster size and performance.
vcf package available get prometheus.kubernetes.vmware.com

vcf package install prometheus -p prometheus.kubernetes.vmware.com -v 2.53.4+vmware.1-vks.1 --values-file prometheus-data-values.yaml -n package-installs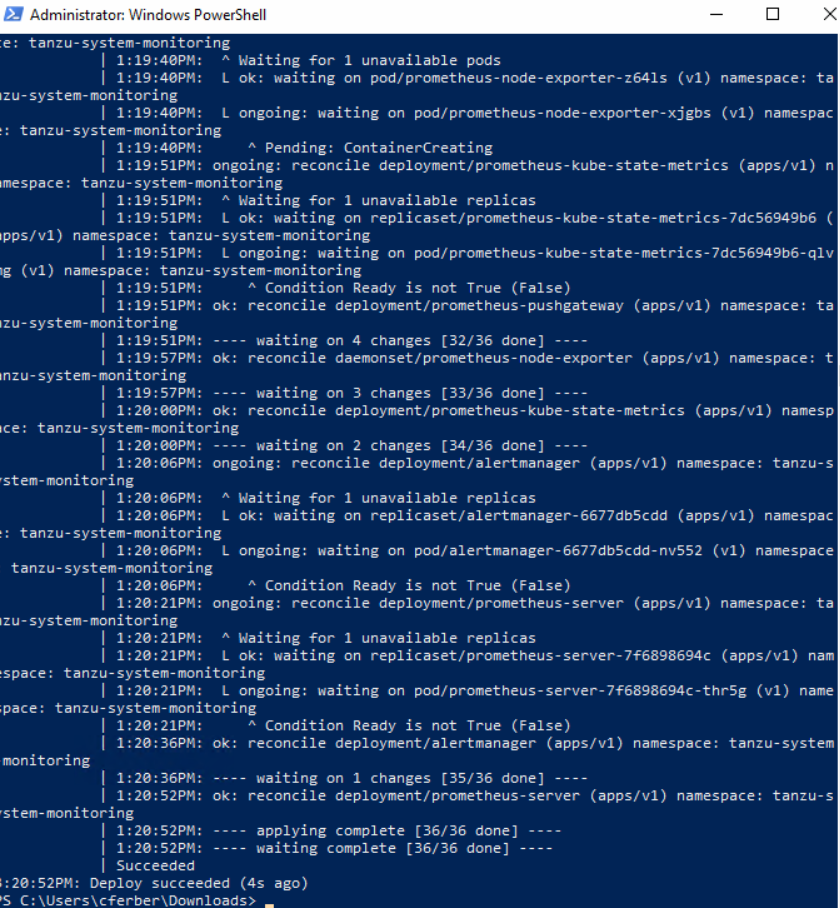
You can now verify if all required pods are running successfully.
kubectl get all -n tanzu-system-monitoring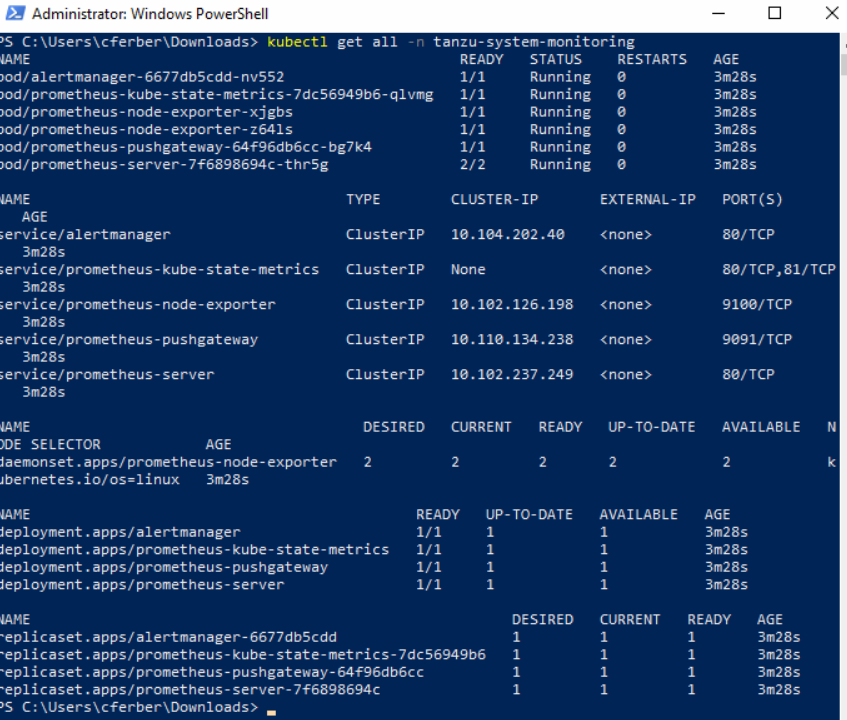
Configure VKS Cluster in VCF Operations
Once telegraf and prometheus are installed on the VKS Cluster, the dashboards will already receive information from the Kubernetes clusters. However if you’d like to get container and pod monitoring data as well you must enable that in VCF Operations explicitly for the cluster in question. For this use the inventory view, browse to your supervisor cluster and go to the environment tab. Use the search field to search for your VKS cluster.

Select the VKS cluster (Adapter: vSphere Supervisor, Object Type: VKS Cluster) and edit it with the pencil icon in the top menu.

In the upcoming screen set the “Pod And Container Monitoring Enabled” to true and click “OK”.

Testing the VKS Cluster Metrics
It might take some time until all metrics are populated. In general, you can use the “Kubernetes VKS Cluster” Dashboard to see the data available. A subset of the metrics available in VCF Operations will be presented in VCF Automation as well.


Have fun!

- VCF 9 – Automated Offline Depot Server Creation - 19. May 2026
- VCF Automation 9 – Content Libraries - 18. May 2026
- VCF 9 – Management Domain with vSphere 8 - 1. April 2026